Gujarat registers 6 per cent year-on-year increase in GST collection in September 2020
October 01, 2020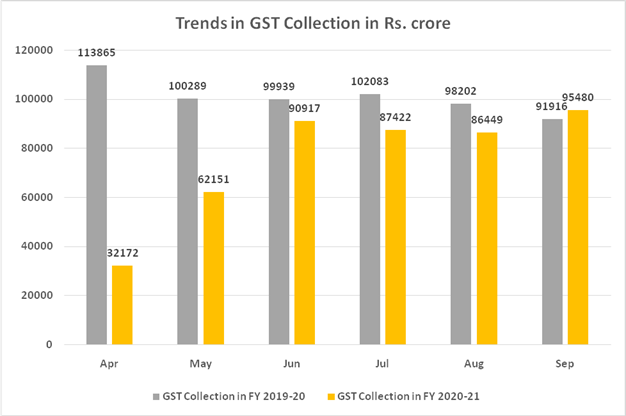
New Delhi: Gujarat has registered 6 percent increase in GST revenue collection in the month of September 2020 compared to GST collection in the same month in previous year. While in September 2019, Gujarat had registered Rs. 5,741 crore GST collection, the State has in September 2020 registered Rs. 6,090 crore GST collection which shows 6 per cent increase year on year.
In the month of August 2020, GST revenue collection in Gujarat was 3 per cent down compared to August 2019. The State had registered GST revenue collection of Rs. 6,030 in August 2020 compard to Rs. 6,185 crore in August 2019.
Nationwide, the gross GST revenue collected in the month of September, 2020 is Rs. 95,480 crore of which CGST is Rs. 17,741 crore, SGST is Rs. 23,131 crore, IGST is Rs. 47,484 crore (including Rs. 22,442 crore collected on import of goods) and Cess is Rs. 7,124 crore (including Rs. 788 crore collected on import of goods).
The government has settled Rs. 21,260 crore to CGST and Rs. 16,997 crore to SGST from IGST as regular settlement. The total revenue earned by Central Government and the State Governments after regular settlement in the month of September, 2020 is Rs. 39,001 crore for CGST and Rs. 40,128 crore for the SGST.
The revenues for the month are 4% higher than the GST revenues in the same month last year. During the month, the revenues from import of goods were 102% and the revenues from domestic transaction (including import of services) were 105 % of the revenues from these sources during the same month last year.
The chart shows trends in monthly gross GST revenues during the current year. The table shows the state-wise figures of GST collected in each State during the month of September 2020 as compared to September 2019 and for the full year.
Table: State-wise Collection till September, 2020*
| State Code | State Name | |||
| Sep,19 | Sep,20 | Growth | ||
| 1 | Jammu and Kashmir | 282 | 368 | 30% |
| 2 | Himachal Pradesh | 609 | 653 | 7% |
| 3 | Punjab | 1133 | 1194 | 5% |
| 4 | Chandigarh | 157 | 141 | -10% |
| 5 | Uttarakhand | 1017 | 1065 | 5% |
| 6 | Haryana | 4110 | 4712 | 15% |
| 7 | Delhi | 3386 | 3146 | -7% |
| 8 | Rajasthan | 2253 | 2647 | 17% |
| 9 | Uttar Pradesh | 5073 | 5075 | 0% |
| 10 | Bihar | 986 | 996 | 1% |
| 11 | Sikkim | 209 | 106 | -49% |
| 12 | Arunachal Pradesh | 44 | 35 | -20% |
| 13 | Nagaland | 21 | 29 | 43% |
| 14 | Manipur | 42 | 34 | -19% |
| 15 | Mizoram | 29 | 17 | -42% |
| 16 | Tripura | 52 | 50 | -3% |
| 17 | Meghalaya | 106 | 100 | -6% |
| 18 | Assam | 848 | 912 | 8% |
| 19 | West Bengal | 3255 | 3393 | 4% |
| 20 | Jharkhand | 1509 | 1656 | 10% |
| 21 | Odisha | 2015 | 2384 | 18% |
| 22 | Chattisgarh | 1490 | 1841 | 24% |
| 23 | Madhya Pradesh | 2087 | 2176 | 4% |
| 24 | Gujarat | 5741 | 6090 | 6% |
| 25 | Daman and Diu | 89 | 15 | -83% |
| 26 | Dadra and Nagar Haveli | 125 | 225 | 79% |
| 27 | Maharastra | 13579 | 13546 | 0% |
| 29 | Karnataka | 6350 | 6050 | -5% |
| 30 | Goa | 311 | 240 | -23% |
| 31 | Lakshadweep | 2 | 1 | -58% |
| 32 | Kerala | 1393 | 1552 | 11% |
| 33 | Tamil Nadu | 5616 | 6454 | 15% |
| 34 | Puducherry | 149 | 148 | -1% |
| 35 | Andaman and Nicobar Islands | 19 | 19 | 2% |
| 36 | Telangana | 2854 | 2796 | -2% |
| 37 | Andhra Pradesh | 1985 | 2141 | 8% |
| 38 | Ladakh | 0 | 9 | 0% |
| 97 | Other Territory | 132 | 110 | -16% |
| 99 | Center Jurisdiction | 35 | 121 | 247% |
| Grand Total | 69091 | 72250 | 5% | |
* Does not include GST on import of goods
Table: State-wise collection till August
| Aug-19 | Aug-20 | Growth | ||
| 1 | Jammu and Kashmir | 302 | 326 | 8% |
| 2 | Himachal Pradesh | 676 | 597 | -12% |
| 3 | Punjab | 1,255 | 1,139 | -9% |
| 4 | Chandigarh | 160 | 139 | -13% |
| 5 | Uttarakhand | 941 | 1,006 | 7% |
| 6 | Haryana | 4,474 | 4,373 | -2% |
| 7 | Delhi | 3,517 | 2,880 | -18% |
| 8 | Rajasthan | 2,550 | 2,582 | 1% |
| 9 | Uttar Pradesh | 4,975 | 5,098 | 2% |
| 10 | Bihar | 981 | 967 | -1% |
| 11 | Sikkim | 163 | 147 | -10% |
| 12 | Arunachal Pradesh | 45 | 35 | -22% |
| 13 | Nagaland | 27 | 31 | 17% |
| 14 | Manipur | 37 | 26 | -29% |
| 15 | Mizoram | 28 | 12 | -56% |
| 16 | Tripura | 58 | 43 | -26% |
| 17 | Meghalaya | 117 | 108 | -7% |
| 18 | Assam | 768 | 709 | -8% |
| 19 | West Bengal | 3,503 | 3,053 | -13% |
| 20 | Jharkhand | 1,770 | 1,498 | -15% |
| 21 | Odisha | 2,497 | 2,348 | -6% |
| 22 | Chattisgarh | 1,873 | 1,994 | 6% |
| 23 | Madhya Pradesh | 2,255 | 2,209 | -2% |
| 24 | Gujarat | 6,185 | 6,030 | -3% |
| 25 | Daman and Diu | 103 | 70 | -32% |
| 26 | Dadra and Nagar Haveli | 159 | 145 | -9% |
| 27 | Maharashtra | 13,407 | 11,602 | -13% |
| 29 | Karnataka | 6,201 | 5,502 | -11% |
| 30 | Goa | 325 | 213 | -34% |
| 31 | Lakshadweep | 1 | 0 | -72% |
| 32 | Kerala | 1,582 | 1,229 | -22% |
| 33 | Tamil Nadu | 5,973 | 5,243 | -12% |
| 34 | Puducherry | 161 | 137 | -15% |
| 35 | Andaman and Nicobar Islands | 30 | 13 | -59% |
| 36 | Telangana | 3,059 | 2,793 | -9% |
| 37 | Andhra Pradesh | 2,115 | 1,955 | -8% |
| 38 | Ladakh | 0 | 5 | |
| 97 | Other Territory | 170 | 180 | 6% |
| 99 | Centre Jurisdiction | 100 | 161 | 61% |
| Grand Total | 72,543 | 66,598 | -8% |
[1] Does not include GST on import of goods
Related Stories
Gujarat GST collection 26% up in Nov 2021 compared to Nov last year; nationwide 20% up
Gujarat registers 25 per cent year on year GST revenue growth in October 2021
GST collection in Gujarat 25 per cent up in August 2021
GST Revenue collection for December 2020 recorded all time high since implementation of GST
GST collection in Gujarat in November 2020 up by 11 per cent compared to same month last year
Gujarat registers 15 per cent year-on-year increase in GST collection in October 2020
Recent Stories
- Gujarat Congress General Secretary Ashok Dangar quits party; rejoins BJP
- Aadhar Housing Finance Ltd.'s IPO to open on May 8th
- Dish TV announces ‘Dish TV Smart+’ services, offering TV and OTT on any screen, anywhere
- Gujarat likely to feel heatwave on Lok Sabha polling day
- Bandra - Vaishnodevi special train gets additional halt at Valsad
- AirAsia launches Ahmedabad - Kuala Lumpur direct flight; to operate 4 days a week
- Kshatriya youths in Surendranagar burn Rahul's effigy over his remarks